

What Would your Investment Have Done if you Purchased the S&P 500 at the Highest Price Each Year?
A few years ago, while getting into the groove of working full-time in finance, I had a question emerge in my mind. What would happen if I could purchase the S&P 500 at the exact high every single year? Now understand that the S&P 500 is an index, and individuals cannot invest directly into any index. This is not only due to weightings of the stocks being dynamic, but also investment fees are not taken into account in regards to the Index’s returns. I found the attached article(s) as well that discuss similar ideas in more depth and thought these might be a good read for anyone who’s also thought about a similar thing. Although, these articles discuss buying at an “all time high” which is similar, but not the same to buying at the exact high. Why? The S&P can hit an all-time high multiple times in a year, but can only hit its high for the year once. Also, the high for a given year does not have to be an all-time high. For example, there was a high for the year 2009, but that was not an all-time high for the index. Overall, I found the data to be eye-opening in a comforting way under both circumstances.
Being the person who ends up buying at the exact high in a given year wouldn’t feel great in the short-term. Over time though, the data suggests that it would have been prudent to stay invested instead of selling to find a better time to buy. Below, I have aggregated the data into pie charts from 1928-2022 if you waited 5, 10, 15 & 20 years from that purchase at the exact high. I used the data presented on a site called Macrotrends (source 1), feel free to browse that data as well to verify what I am presenting to you here.
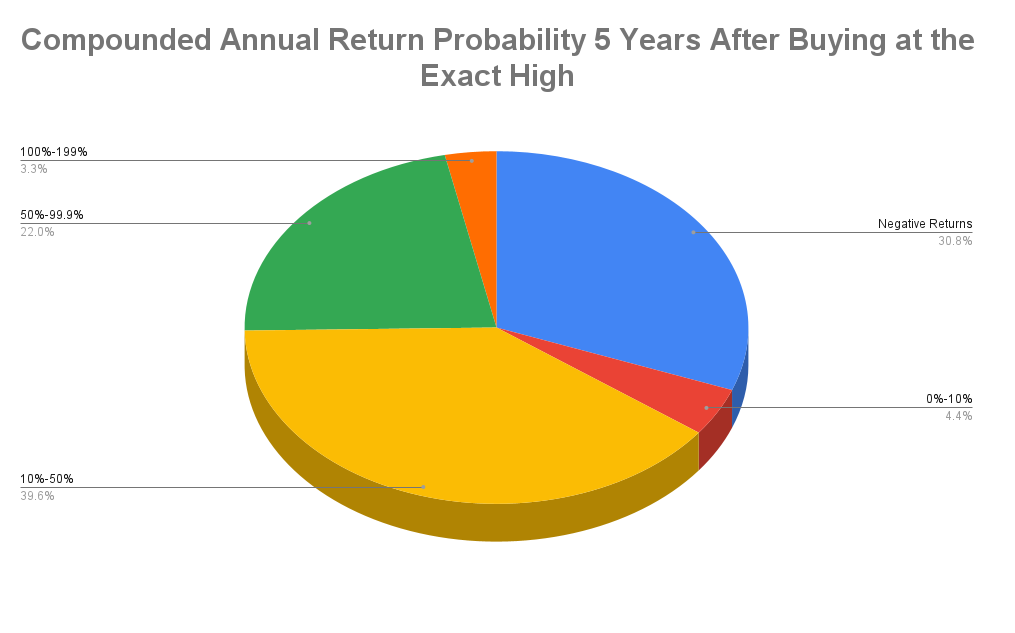
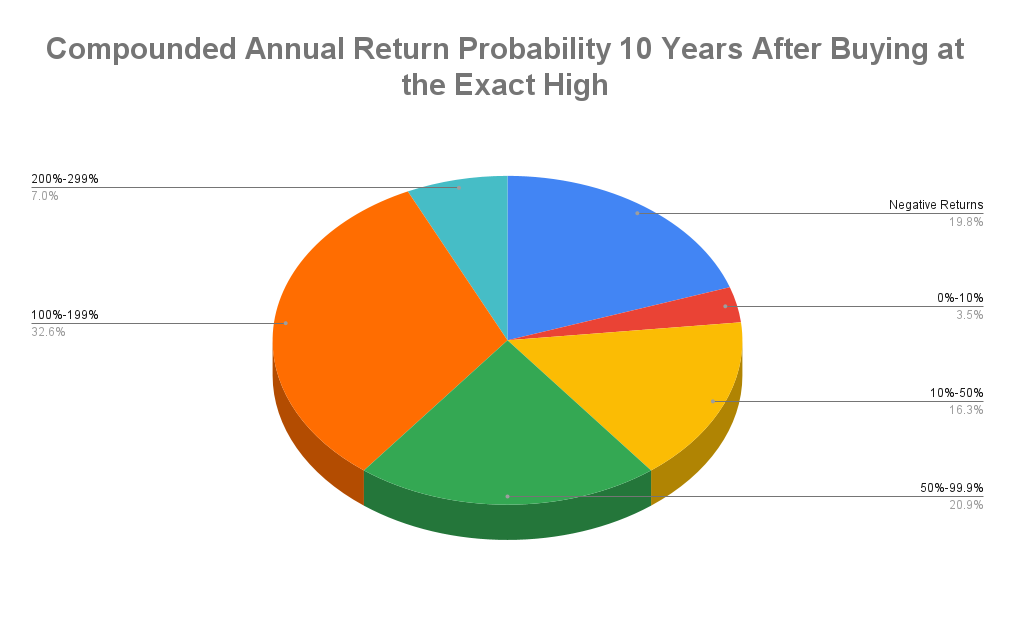
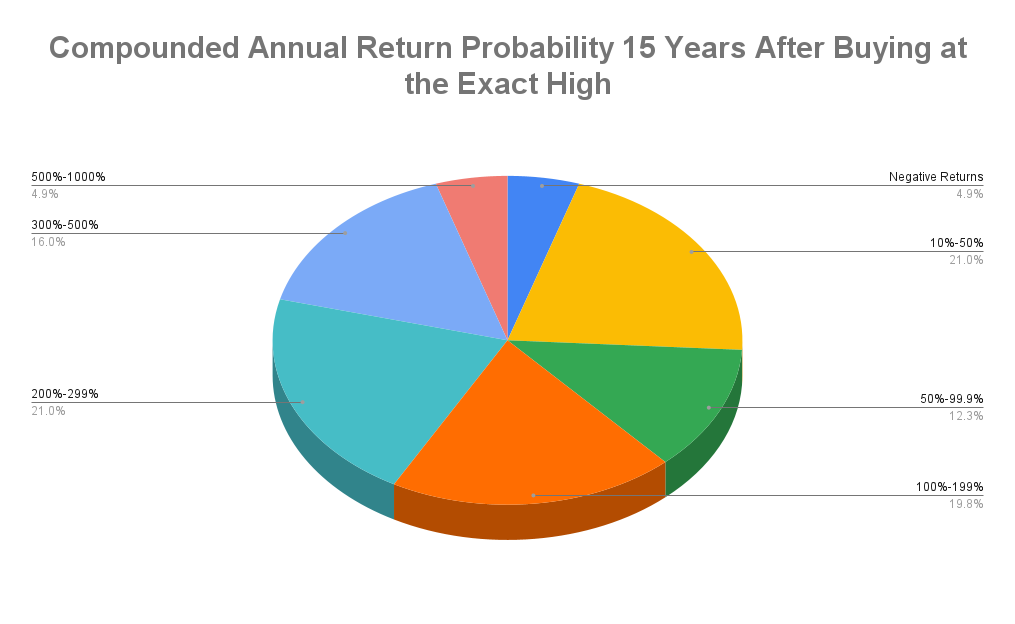
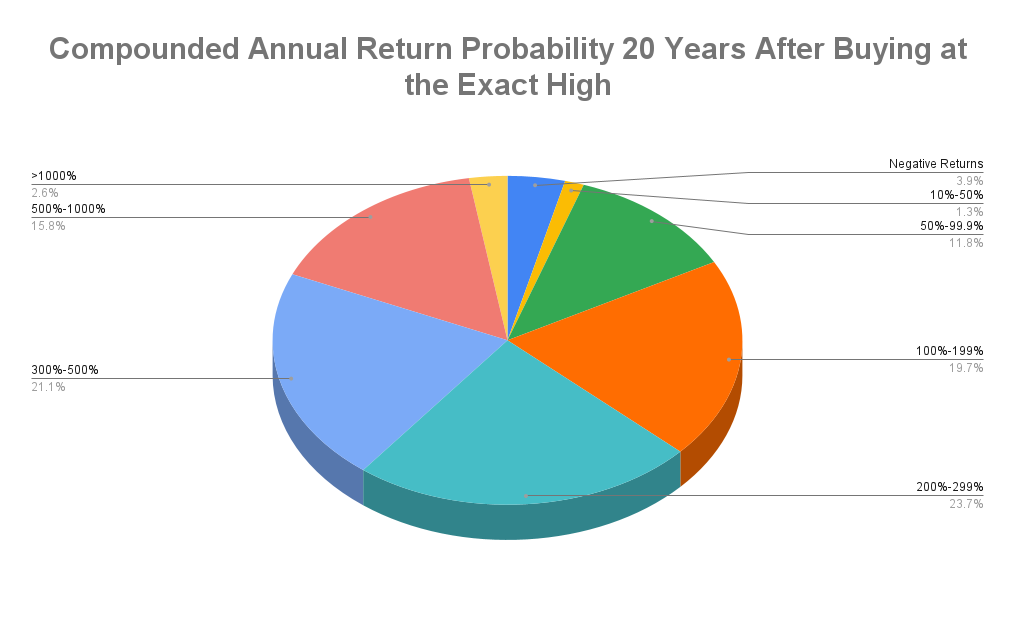
The above charts are a hypothetical example for illustration purposes only. Actual investor results will vary. This assumes investing in the S&P 500 Index at the yearly high each year starting in 1928 and each subsequent year through 2017 and holding each investment for 5 full years (Chart 1). Starting in 1928 and each subsequent year through 2012 and holding each investment for 10 full years (Chart 2). Starting in 1928 and each subsequent year through 2007 and holding each investment for 15 full years (Chart 3). Starting in 1928 and each subsequent year through 2002 and holding each investment for 20 full years (Chart 4). For this illustration, dividends and taxes are not included. Keep in mind that individuals cannot invest directly in any index, and index performance does not include transaction costs or other fees, which will affect actual investment performance. Individual investor's results will vary. Past performance does not guarantee future results.
Not very surprising, but if you waited “5 years”, over 30% of the time you would have had negative returns. Once you get to “20 years”, your chance of being negative historically was actually below 5%. Also, note that the only time you would have been down 20 years later was on the 20-year investments made during the 1928-30 period. Can something like that take place again? Absolutely, and probably will at some point in the future. If in a time like that though, I would not be afraid of purchasing investments at those lower prices if and only if appropriate for your situation (aka, if you are in need of that money soon, do not do this). Why? Well, here is the average returns that each of those time periods would’ve given you in the past:
5 Years: 24.0% (About 4.4% a year)
10 Years: 79.4% (About 6.0% a year)
15 Years: 181.4% (About 7.1% a year)
20 Years: 304.1% (About 7.2% a year)
HOW THE ANNUALIZED RETURN WAS CALCULATED
The annualized return was calculated based on a compounded annual return. For example, if you divide 24% by 5 you would get 4.8% (a simple return). In reality though, the return in a stock is not a simple return but a compounding return. So, for calculating a compounded return, I use a HP10-bII+ calculator (A great tool for financial calculations if anyone is wanting to find a good, affordable calculator for finance).
The inputs would be:
Present Value = $1,000
Years = 5
Future Value = $1,240 (24% Gain)
With those inputted, the calculation will give me the compounding annualized return for a 24% gain over a 5-year period equaling 4.4%. This calculation was done the same way for all components listed above. Only adjustments are changing the future value to the average percentage gain (in dollars) over the period and also the number of years for each calculation.
As you can see, buying at the exact high in any given year based on past performance has had surprisingly great results. Also, the longer you wait, the more the data skews to average market returns. The question is do you have the ability going forward to let the investment results play out? Maybe this article gives you some comfort needed to do so!
Unsurprisingly, some of the best returns in the past come after a market for around 10 years or so has been flat/down, aka “lost decades”. Why? Well, when less people are buying due to fear, prices in turn are lower for the same business which can potentially lead to better returns in future years (once others actually want to start buying stocks again). When inevitably those “lost decades” return, don’t be afraid to be the only one you know accumulating securities. The less people buying overall, the better potential return you could have over time! I believe this is because it’s not what you buy, it’s what you pay for it! When less people are buying, the prices are in turn generally better for the long-term investor. Lesson of the day, be greedy when others are fearful.
For data about buying at an all-time high, I suggest you read the articles linked below the sources section. This is because I have not done the math myself, but I believe they give you a similar picture to what is being outlined above. The differences between those articles and my analysis are listed in the introduction. But basically, an all-time high can happen multiple times in a year but the high for the year can only be hit once. Also, the high for a year is not necessarily an all-time high (example, 2009). They are very informative and give you more information to sink your teeth into.
In summary, this information shows you that the world tends to get better whether we choose to notice or not! Stay positive/optimistic about the future, positivity is an infectious trait that rubs off on others. Don’t let fear drive decisions not just in finances, but in your life as well! Historically, the patient person has seen respectable results when buying at the exact high in a given year over time. Also, odds are you will rarely buy at the exact high every single year you invest! Thank you, readers, and sorry for the delay in recent articles. Life can get busy but I will do my best to post more consistently going forward. Feel free to reach out to me with any questions that might arise or you are curious about my data collection/ evaluation process!
Riley Sisson
Branch Manager, RJFS
Any opinions are those of Riley Sisson and not necessarily those of Raymond James.
The foregoing information has been obtained from sources considered to be reliable, but we do not guarantee that it is accurate or complete, it is not a statement of all available data necessary for making an investment decision, and it does not constitute a recommendation. Future investment performance cannot be guaranteed, investment yields will fluctuate with market conditions.
The S&P 500 is an unmanaged index of 500 widely held stocks that is generally considered representative of the U.S. stock market. Keep in mind that individuals cannot invest directly into any index, and index performance does not include transaction costs or other fees, which will affect actual investment performance. Individual investor’s results will vary. Past performance does not guarantee future results.
The foregoing conclusions reached by Riley Sisson are not necessarily conclusions of Raymond James. Raymond James has reviewed the information provided, but does not guarantee the information’s accuracy in regards to what is presented from the source throughout this article. Riley Sisson is solely responsible for the potential inaccuracies of the data provided within. Raymond James & Riley recommend doing your own research into the data before acting upon such data, and cannot provide guidance on whether future periods will lead to similar results.
Sources:
https://www.macrotrends.net/2324/sp-500-historical-chart-data
Attached Articles to Research in more depth:
https://www.forbes.com/sites/kristinmckenna/2021/03/05/should-i-invest-when-the-market-is-high-dispelling-the-buy-low-sell-high-myth/?sh=401e7e315376
https://www.rbcgam.com/en/ca/learn-plan/investment-basics/investing-at-all-time-highs/detail
https://www.approachfp.com/should-you-invest-when-markets-are-high/